Share this
by Infegy Research Team on July 10, 2019
One important task for your team is reporting.
Your life might look like a lot of this: 📊📉📈
Whether it’s conducting market research, tracking campaigns, researching audience segments, analyzing brand health, improving products or other types of data-driven analysis, building reports is time consuming, challenging and not always fool-proof.
How do you get the best data on your research topic, and how do you get that data into a beautiful report that tells a story (hopefully a good story 😉)?
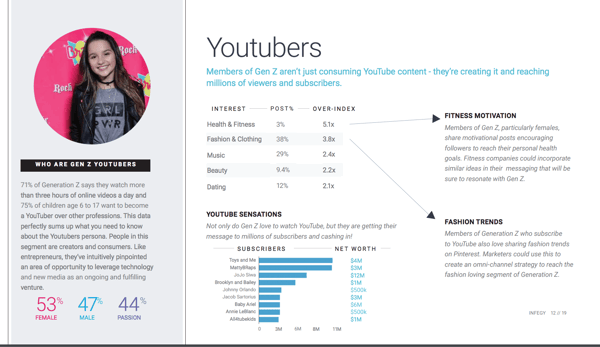
We covered Gen Z audiences in the Gen Z Personas Report, which analyzes who they are, what they value and how brands can connect with them.
Humble brag alert! 🚨
Social listening analytics from platforms like Infegy Atlas help us discover compelling and useful consumer and brand insights-- ones that you can’t find anywhere else. Subsequently, they help us build the best consumer research reports this side of the Milky Way. Don’t believe us? Download one and see for yourself.
Now, the question becomes: how do we build our social listening reports?
These reports aren’t quickly thrown together with generic research data. We use game-changing social listening analytics, yes. But we also do process-driven research.
In order to build a successful social listening report, you need to ask the right questions. Understand the problem you’re trying to solve. Then seek out the appropriate data to answer those questions.
Only then can you create a great handy dandy report your team can be proud of.
Here’s your 10-step program to producing your best social listening reports:
Step 1: Establish the Problem You're Trying to Solve
Reports aren’t built for just showcasing numbers. They are made to help solve a problem and illustrate the effectiveness of solutions.
Don’t just show me the data, show me why we need to know it. Then explain what to take away from that data and what the next step should be as a result.
The best data reports start with a documented problem that everyone involved in making the report shares as a common endgame in producing the report.
Important to remember is that this problem must be reader-centric. Solve the problem for the person who will be consuming the report, whether that’s a customer, a prospect, or your boss in the board meeting-- whoever the audience is.
When we build our social listening reports, we ask ourselves:
- What is the root pain point or question that the reader is asking?
- How does the information in the report help the reader solve their problem?
- Does the information on each slide service in answering that problem?
For example, when we created the social listening report on Gen Z consumer personas, we sought to answer a problem our actual customers were having. Over and over again, they were asking us: “how do we find out more about Gen Z?”.
Generation Z is a notoriously difficult segment to understand because they haven’t garnered enough sales or market research data for most brands and agencies to analyze yet.
The problem that we started with: how to learn more about Gen Z.
Our report answers that, not just by showing how to learn more about Gen Z, but also by providing the information about Gen Z that our customers would want to learn. We probably would not have made as quality of a report had we not established a true problem we were trying to solve.
Rather than just gather data about Gen Z, this report shows you how to think when analyzing Gen Z. What is your mindset when conducting the analysis? That was an important element of the report that would not have existed without establishing our core problem first.
Look back at those three questions in the bulleted list above. Refer to them constantly. Make sure you are addressing them every step of the way as you build your report, including the next 9 steps:
Step 2: Do Preliminary Market Research
Every report should begin with establishing information you already have. In scientific studies, they use the section at the beginning of their report, the Abstract, by explaining to the audience what is already known.
We split our preliminary research into two parts: 1. What research is out there that can help us understand the market and 2. What base information do we have inside our social tool
Sometimes this data from previous research conducted by other parties. Sometimes this is a recap of data from a previous report to establish a base or context. It could be a quick search within tools like Google Trends for consumer search trends or Statista for things like company sales revenue or industry data.
You could also turn to market research agencies like Mintel and IRI, both Infegy clients, to see what research they’ve done on your topic already.
Whether or not your report is going to include some of this information is up to you. But you and your team should always learn that information and have a strong understanding of it before you start your own research. Everyone should be on the same page here. Not establishing these details ahead of time could lead to incorrect analysis.
The easiest research to do is the research that in which has already been done for you.
Once you’ve established some context through third party research, you can start doing some initial research in your social listening tool.
The challenging part about any analytical research is that you may not always, at first, know exactly what you’re looking for. You can’t butcher a fish before you have it on the deck first. You have to actually get some data before you do your primary research.
Make sure you have a big enough sample on your base queries to be able to dive into some actual insights. Are there keywords or hashtags that we are seeing that will help write research questions? Is there a current event or hot topic that could skew your results?
Think about how you want to frame your research and the types of results you need to get before you get too far in the weeds.
Let’s say you’re working on a reporting about brand health of popular retailers. You could start by conducting some quick queries in your social listening tool to establish a base understanding of the current context of the situation.
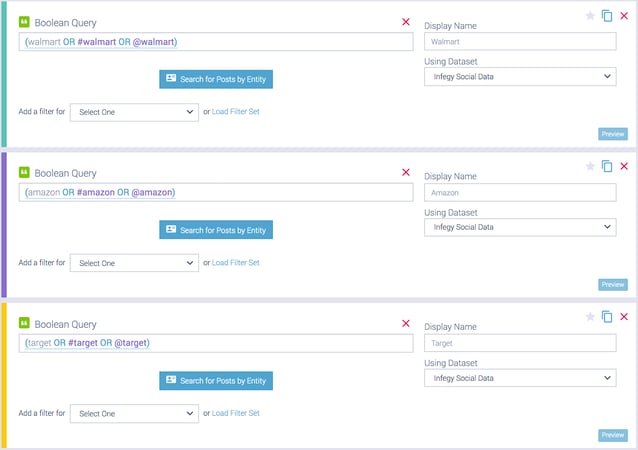
Your first searches came back with some intriguing results. You now know the post volume, sentiment, passion, and talking points for these basic queries.
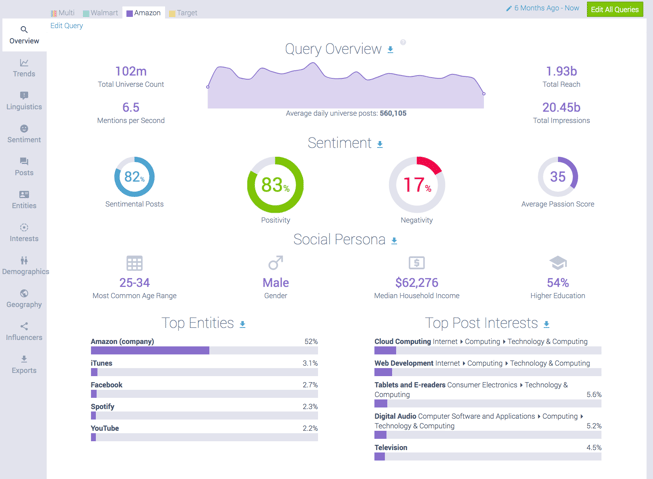
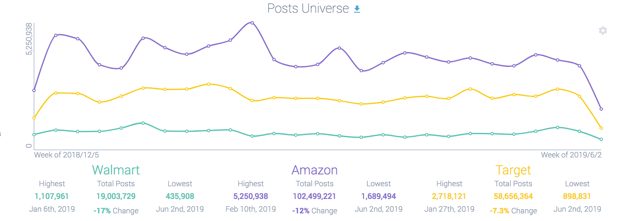
This gives you a nice foundation from which to start so you know a little context before you get too far down the road. Keep the carriage before the horse here. Now you have a high level view of what you’ll be researching; you can now move to the next step: asking your research questions.
Step 3: Write Your Research Questions
When you’re starting out, you need to ask the right questions.
To do so, you need to establish the goal of your report. Then you need to document what your audience is expecting or hoping to get out of reading your research. You’ve already done this in step 1.
In step 2, you sought out research already done and did some initial searches in the social listening tool to get you in a good direction.
From here, you arrive at some educated guesses, predictions and hypotheses that could be included in your report. This is where you start asking the right research questions.
You need to identify the questions you’re seeking to answer with your report. Be specific.
It’s not enough to ask, “what’s the state of the ‘X’ industry?” We need questions that are specific.
Let’s say you’re doing research around what audiences think about certain products or brands compared to others.
You can start to build yourself a web of research questions to ask yourself to help lead you towards the answers you’re looking for.
Here are some examples of the types of questions you might ask:
- When people are talking about competing brands, what are they saying about the brands?
- Do they prefer one over the other, and if so, why?
- Is one audience group more passionate about a certain product than others?
- What use cases or features for a given product do consumers talk about most?
- Does one brand have more positive or negative sentiment than other brands for a feature common to each product?
- Do different audience segments talk differently about a handful of topics?
- For example, is one topic mentioned more by moms than by Gen Z women? Do moms talk more about making purchases when they mention this topic?
- Why are people switching from one product to another?
Step 4: Build Great Queries + Audience Segments
Building search queries are essential to any social listening insight. Your query is your basis to understand everything online. And building an awesome query will help you truly understand what is happening across the web.
The first thing you need to ask yourself is, are you trying to find insight about a specific thing where you can use boolean queries, OR are you trying to find insight around audiences online.
Here are some tips for each type of search:
If you are trying to find insights using queries
Tip 1: Think about how someone would talk about what you are searching. Keep in mind not everyone online speaks the way you do. There could be misspellings, grammar issues, and just level of reading differences from the way you speak to the way other people speak online. Other questions to keep in mind are: Do you want to include ads or retweets? Are there specific channels you want information from? Are you targeting a specific area or language? Are you targeting an age group? Are you wanting to hear from actual people chatting online about their experience?
For example, if you are trying to understand reactions from people watching Game of Thrones you would, you wouldn’t just want to query “Game of Thrones”. This would grab anything online, about Game of Thrones. Advertisements, The Wall Street Journal articles, blogs, etc. To really understand reactions from people, you will need to build a query that brings in comments such as:
“I can’t wait to watch #GameOfThrones on Sunday” Or “We ordered HBO just to watch Game of Thrones”.
Tip 2: Add in any other terms you think could be relevant or close spellings of the key terms you are looking for.
If we stick with the query above around Game of Thrones, other terms could be the use of specific characters in the show. Or, you could search for “Thrones” and “Throwns” (Hey, we’re not all grade-A spellers out there).
Tip 3: Look at the sample posts that come back from your query. Are you seeing anything that looks weird that you want to remove from your query by using the NOT operator. Do you want to filter down to low influence audiences or exclude certain sources such news or Reddit.
Depending on how broad your query is, you may see #ad, political comments or a way your query was used in something that got retweeted a zillion times. :)
Tip 4: After you have updated your search as much as possible, go into the database to see if you are seeing specific keywords or relevant hashtags that could expand the number of posts you get back.
For example: When researching Game of Thrones, by adding the hashtag #GOT, another 25,000 posts are added to the query response
For audience segment searches
Audience segments help you understand specific audiences and what they are talking about in general. For example you could build an audience segment of dog owners or small dog owners or designer dog owners. These queries will look somewhat different from the long-form ones we built earlier. Once you build that base segment, you can create queries inside your audience to understand if your audience has affinity to talk about shopping at specific retail locations more than others, or talk about trying on specific types of clothes, etc.
Tip 1: Determine who your audience is and how you can build a query to grab them online. Will they have specific information in their twitter bio such as #basketballmom OR #dietcokelover OR #budgettraveler OR #couponer
Tip 2: Are you trying to only understand enthusiasts? Will you want to only add in people who have talked about a specific thing 5x in a certain time period. For example, you could build an audience around frequent Target shoppers if they talk about Target 3x in 4 months.
Tip 3: Are there any other criteria you want to use to establish your audience segment such as age range, location, language.
Tip 4: Validate your audience, make sure you are only getting the relevant group in your query.
Tip 5: Implement your audience segment and move back to query building to uncover insight!
Step 5: Answer Your Research Questions + Dive into Insight
Once you have built a great foundation, you can use your queries and audiences to start answering your research questions. There is not one particular way to go about this. Each question and insight has to be broken down and looked at separately.
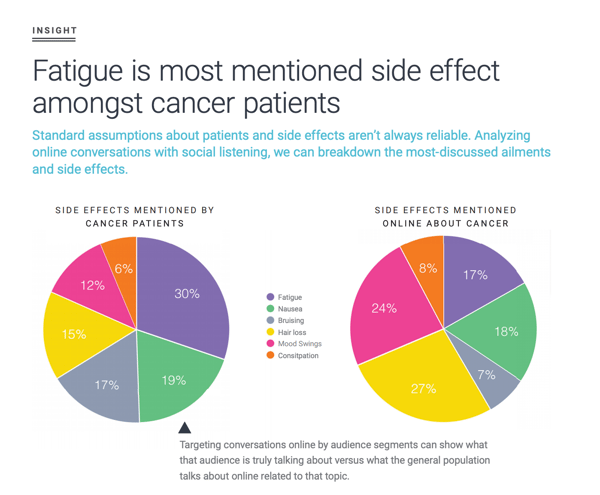
The easiest way to review this may be to look at the example of how we discovered a key insight around cancer treatment side effects.
Our research question was: What symptoms do cancer patients speak the most about online?
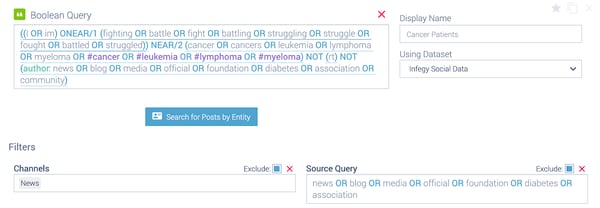
To get to this insight, we first had to build a cancer patient audience segment. Here is an example of how we found cancer patients like #CancerSurvivor online.

We look for someone saying that they have fought or are fighting cancer. We also want to be sure to exclude news sites, media, or other irrelevant sources.
Once we had our audience segment built, we could start looking for specific side effects being spoken about online.
We first took a look at the topic cloud to see if there was anything popping that we didn’t have on our list of side-effects from our original research. Then we started building out our queries to search within our cancer patient audience segment.
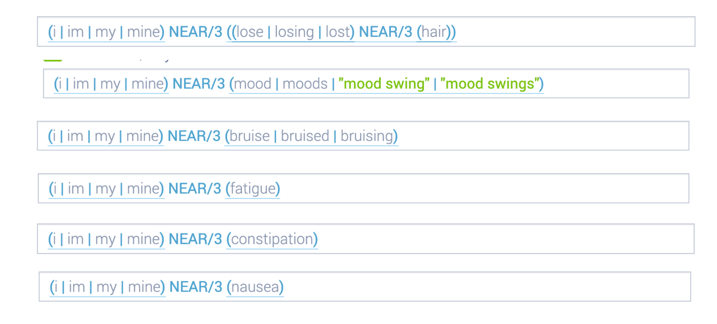
From this data, we can start to understand volume of conversation around each side effect.
When our team was analyzing this data, the statement was made that our data didn’t match assumptions which lead to the next research question. How does this compare to side effects that are mentioned with chemo from non-cancer patients?
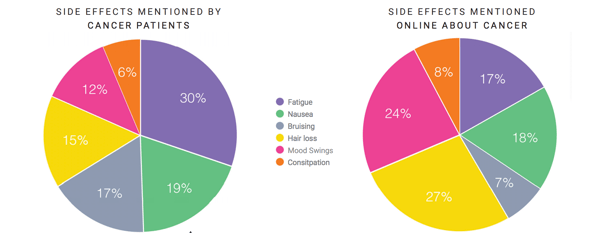
This is an eye-opening insight. We discovered what could be a major misconception about how cancer patients experience their treatments.
While many might point to hair loss as the top side effect for cancer treatment, it is actually fatigue that those in our custom audience segment of cancer patients discussed most.
At this point, you as the researcher have dug in to find a deeper insight, then performed a series of clever query tweaks to find the data that you were looking for when you asked your research question.
As you begin to conduct these searches around each of your research questions, you can now start to compile your insights and build a structure for your report.
Step 6: Build an Outline and Use Your Research Questions + Insights to Structure the Report
We always build an outline for our reports before we get too deep into the nitty gritty of the core research.
The reason for this is because not having a structured way to present your findings and the ways you want to answer your research questions will limit your research.
We view our social listening research as not just a way to report but also an experiment where you test and retest hypotheses to arrive at your core conclusions.
Your report should tell a story and each page within the report should be structured to help tell that story. One of our favorite ways to tell stories with data is with the Minto Pyramid Principle. It gives great structure to any presentation whether that be a report or a ppt for clients. You can watch a quick video of the concept here or read more about it here.
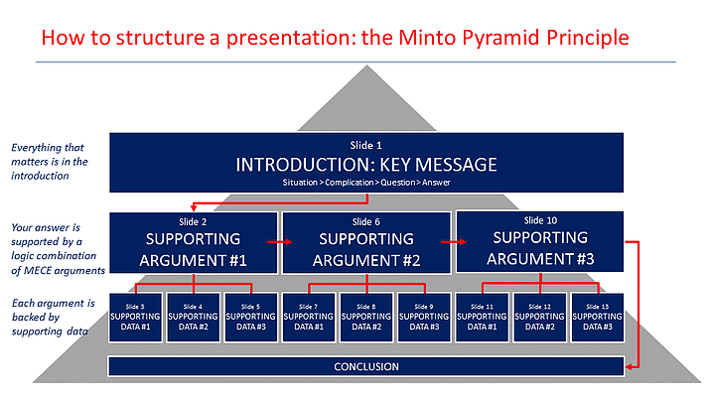
The core concept of the Minto Pyramid Principle is supporting your key messages with the SCQA logic (Situation> Complication> Question > Answer) and answering your key message with supporting data and arguments.
Even if you’re not doing a deep research product and you just want to get to the data, having some kind of outline or format to your report can help you get to the right visuals.
Here we can compare two audience segments on the same visual and also show their differences easily.
Step 7: Review Your Structure with Your Larger Team + Prepare the Rest of Your Slides
Some of our greatest insights have come from previewing our findings with our team.
After all, when you’re doing exhaustive market research, you might miss something in front of you. You might also miss an opportunity for observations, hypotheses, or commentary that someone disconnected from the active research will catch. (That’s especially the case if you have a team full of smart, analytical thinkers like we do, which of course you do :) ).
These outside team members can help you think critically about more than just the data. Remember we want to tell a compelling story and we want the reader to take away important information in an easy and accessible way.
Those outside the primary research will be able to offer quality input on the structure of your report because they see the report with non-biased eyes and fresh perspective. Their feedback will help you to present the report to your audience in the best way.
Challenge your structure.
Think deeply about the formatting, organization and order to your report.
Now that you have your SCQA storyline, your supporting logic, the data to back it up and a concise introduction, you are ready to challenge your structure. You don't want to spend hours producing dozens of slides before you get challenged by another team member and have to change it all, do you?
So as far as you possibly can, stop right here, go meet some colleagues or your boss and make sure people are convinced with your presentation's structure. If your structure is solid, it should resist. If it doesn't, then you will just need to rework the structure-- not a huge number of completed slides.
Now that you have defined your logic and what piece of data is going to support it, just make the corresponding slides. It should be much easier now that you know exactly where you are going.
Make sure your titles reflect that logic and that if people only read the title (like that guy sitting last row in the room who forgot his glasses), they will still understand your storyline.
Remember to use action titles, i.e. actual sentences with a verb in it. That way people don't need to guess what your point is or interpret the content of your slide.
This will help the data stand on its own and not bog people down in trying to understand what it is you’re trying to say with each slide.
Now, you have a winning structure to your report, you fill out your slides and design something good to look at and get it ready to share.
Before your share your final report though...
Step 8: Wrap It Up
We do a final walk through with the immediate research and marketing team to make sure that the report is tied together with a nice bow.
This involves double checking all of the data to ensure everything adds up and that the analysis is correct.
Sometimes we’ll catch a data point that seems off somehow and go back to check if it’s accurate.
Social listening tools like Infegy Atlas allow you to be quick and nimble on your feet. With the ability to save workspaces and queries and also customize audience segments to save for later, you can jump back into your research with little effort or lag time.
Most social listening tools don’t have this capability. And that’s why you’ll want to make sure you’re invested in the right software to make sure you’re able to get back into your research quickly if need be.
Step 9: Share It!
You’re done with your report; now it’s time to present it.
Keep the steps you learned here in mind as you do so, whether you’re sharing it by email or on a screen in front of a physical audience.
Remember that you began making this report with an established problem. Be sure you address that problem and explain to your audience how the report will help solve that problem.
Be sure also to express a point of view or argument for your report. Let people know why it’s important for them to read and, more importantly, what the crucial takeaways of the report are.
Rehash the research questions that you asked during your research that helped you arrive at the the data visualized in your report.
We do this in our emails with a bulleted section when we send out the report our subscribers:

If you’re sharing the report on social media or in other marketing materials, consider including the established problem, the research questions, the ‘why’ of your report, and the key takeaways as part of the messaging.
Also, don’t forget to credit your sources of the outside research and data that you got from elsewhere.
Now you’re ready to do great things with your social listening report. Hopefully these 10 steps will help you when creating your own reports.
Remember: we’re always here to help with any questions you have.
Step 10: Read an Example and Get Started
Download the Gen Z report below or one of our other reports to see these steps in action. Then get going on your own report :)